SGX-CA900
Visualize your pedaling with a powerful high-data cycling computer Data on power (left&right independently), pedaling efficiency, pedaling graphs; ANT+™ standard speed sensor, heart rate monitor, and more. Over 100 types of data accessible in real time.Over 100 types of data accessible in real time
Pedaling graph, pedaling efficiency, power, distance, speed*, heart
rate*, temperature, atmosphere, elevation, gradient, and more.
Over 100 types of measurable data available. With 16 layout patterns, measurement reporting can be adapted to training, races, and any other setting in which an athlete might perform.
* ANT+™ standard sensor required.
Over 100 types of measurable data available. With 16 layout patterns, measurement reporting can be adapted to training, races, and any other setting in which an athlete might perform.
* ANT+™ standard sensor required.
Data Field Type/Pattern List
Data fields: 5
- Cadence
- Power LR
- Power Lap Avg
- Pedaling L
- Pedaling R
Data fields:4
- Time WO
- Distance WO
- 3s.Avg Power
- Speed
Data fields:9
- Power WO Max
- Power WO Avg
- Cadence WO Max
- Distance WO
- Temperature
- Atmospheric Pressure
- Elevation Gain WO
- Clock Time
- Date
Layout Pattern List
Pedaling training
Race
Multi-display
Heart rate, Power training
Left-right pedaling balance
Easy-to-understand graphical displays
By displaying data in easy-to-read graphs, athletes can intuitively gain information even in mid-ride.
From the Pedaling Graph, used to grasp the characteristics of your pedaling at a glance, to the Time Series Graph, which displays heart rate and power on a time axis, there are many tools available to push yourself to the next level.
From the Pedaling Graph, used to grasp the characteristics of your pedaling at a glance, to the Time Series Graph, which displays heart rate and power on a time axis, there are many tools available to push yourself to the next level.
■Time Series Graph
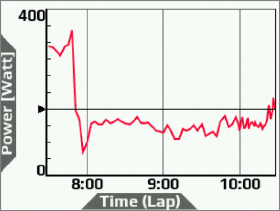
Displays information obtained from the sensors on a line graph as time advances.
■Scatter Chart
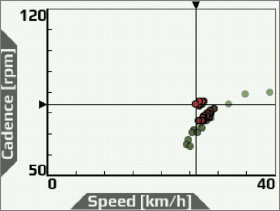
Displays information obtained from sensors on a two- variable scatter plot.
■Histogram
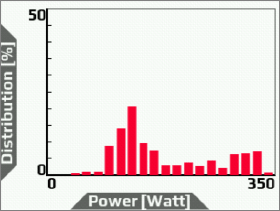
Displays information obtained from sensors as a bar graph in accordance with data analysis conditions.
■Realtime CP
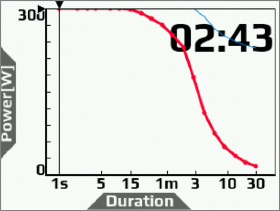
Displays the average power per hour relative to CP curve (a curve calculated from the continuous available power in a fixed time) as time advances on a line graph.
■Pedaling Chart
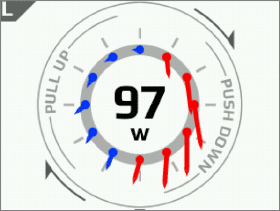
Shows the pedaling force value or direction (vector). Current power (W) is displayed in the center of the graph.
■ForceAngle
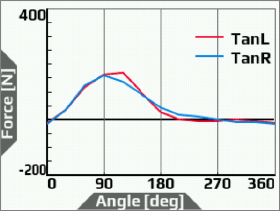
Shows a line graph of pedaling force values for each pedaling angle. (Twelve o’clock direction of the crank is 0° (degree).)
Touch panel allows intuitive use
The adoption of touch panel technology enables quick, intuitive use even while riding.
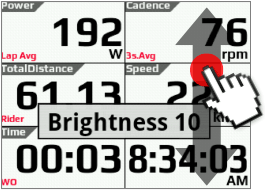
Expand and zoom, use your finger to change pages left and right, or move up and down to adjust screen brightness.
Expand and zoom, use your finger to change pages left and right, or move up and down to adjust screen brightness.
■One-touch expansion
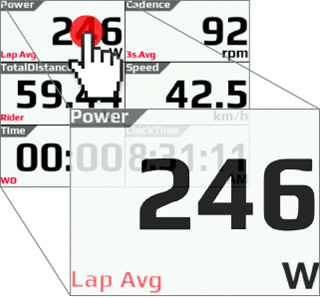
■Adjust brightness by scrolling up and down
■Change pages by scrolling left and right

Input FTP, CP, AWC, maximum oxygen intake, and other information to obtain high-level riding data
By inputting data like FTP (the maximum amount of power an athlete can
maintain for one hour), CP (the amount of power an athlete can maintain
for a set time), AWC (the maximum amount of work producible from an
anaerobic energy system) and maximum oxygen intake into the "SGX-CA900"
cycle computer, calculate high-level data for your ride.
Set a customizable GPS logging interval and create a detailed recording of speed, path taken, and other data.
* By inputting an athlete's FTP, power data can be returned as a % FTP value.
* By inputting an athlete's AWC, a CP curve can be calculated in real time and displayed to the top-right of the CP graph.
* By inputting an athlete's maximum oxygen intake, calorie expenditure can be calculated.
Compare current data with past riding data at any time
By viewing past data before departure, set a new value as the goal of the day's ride.
After the ride, compare the two sets of data (previous and current ride data) to easily evaluate performance.
After the ride, compare the two sets of data (previous and current ride data) to easily evaluate performance.
Specifications

- Connection possible to Pedaling monitor sensor, ANT+™ *1 sensor
- GPS , barometer (gradient, distance) , thermometer built-in
- Uses a high visibility touch panel display, and button placement designed for easy operability
- Able to analyze riding data using the “Cyclo-Sphere” dedicated cloud service
| Weight | 126g |
|---|---|
| Dimensions | 70mm(W) X 85mm(H) X 21.5mm(D) |
| Connector | miniUSB |
| Water-resistance | IPX6 |
| Communications system (sensors) |
ANT+™ *1 standard |
| Positioning system (latitude/longitude) |
GPS |
| Positioning system (altitude) |
Atmospheric pressure sensor |
| Display | QVGA 320x240 pixel, 2.2” Touch panel (Resistive membrane type) |
| Built-in flash memory | 8GB (6GB for user use) |
| Guaranteed operational temperature range |
-10 to 50°C |
| Power supply voltage | DC 5V |
| Battery type | Lithium-ion battery |
| Battery operating time *2 |
Approximately 12 hours (brightness 5) |
| Charging time | Approximately 4 hours (normal charge); Approximately 3 hours (fast charge) |
| Accessories | Bracket (for 31.8mm diameter handlebar), bolt, USB cable, strap, mounting guide/user manual, warranty |
*2 The battery operating time may decrease depending on the operating conditions.
• Specifications and design are subject to change without notice.


